Dont forget RG3 the game manager!The Bills are apparently also reaching out to our very own smogon user some hero. They want to hire him as a QB consultant to help them spot talent, since he has provided such expert analysis on Eli Manning and Tony Romo.

-
Welcome to Smogon! Take a moment to read the Introduction to Smogon for a run-down on everything Smogon, and make sure you take some time to read the global rules.
-
Congrats to the winners of the 2023 Smog Awards!
The Everything NFL Thread - 2012 Season (Up til 2013 Draft)
- Thread starter DM
- Start date
- Status
- Not open for further replies.

Even if it's April Fools Day and I won't believe anything until tomorrow, Niners getting McCoy as a backup doesn't sound too bad, I always thought he was an ok guy on a bad team, and with the Niners talent, he should be able to come in and save games if it happens.
Also, Jim Harbaugh for best prank so far.
Also, Jim Harbaugh for best prank so far.
With Oakland getting Matt Flynn, they are trying to trade Carson Palmer to Arizona which seems to be close to reality with Arizona releasing John Skeleton.
As for McCoy to the 49ers, I didn't even know that the Browns signed Jason Campbell. With McCoy going there, the 49ers solved their backup problem.
As for McCoy to the 49ers, I didn't even know that the Browns signed Jason Campbell. With McCoy going there, the 49ers solved their backup problem.
So, how long till Stanton throws a whiny fit to be traded now tha the Cardinals have Palmer...that's what he did after the Jets brought in Tebow right?
I dunno, Palmer is no Kurt Warner, and with no better protection they're still gonna struggle.
And Nimers get Asomugha, this could be fun if he returns to form like back in Oakland. Revis would've been better, but he costs too much, and Nnamdi is salvageable I think.
I dunno, Palmer is no Kurt Warner, and with no better protection they're still gonna struggle.
And Nimers get Asomugha, this could be fun if he returns to form like back in Oakland. Revis would've been better, but he costs too much, and Nnamdi is salvageable I think.
Nnandi is scum. He gave up on the Eagles. I visit rival sites and there was an article by an egg fan who took the time to prove Nnandi is scum. On 4/5 i forget different running plays against 5 different teams towards Nnandis side he showed frame by frame the play. And in those 5 times Nnandi was blasted out of the way by the WR where he wasn't a factor to do anything. It was as if he was going up against the best blocking WRs ever to play in the NFL. I dont know about the front 7 but Nnandi is a quitter.
Still a great grab by the niners since their not the eggs.
Still a great grab by the niners since their not the eggs.


hey idiots, remember how good Kolb was (in albeit very limited duty) in Philly when his line actually blocked for him
remember how bad he was in AZ when he got sacked almost 40 times in 6 games last season when his line was Swiss cheese
remember how he is nothing but a bridge to the QB of the future because the Bills might just not be sold on taking anyone in this draft at 8th overall
remember how bad he was in AZ when he got sacked almost 40 times in 6 games last season when his line was Swiss cheese
remember how he is nothing but a bridge to the QB of the future because the Bills might just not be sold on taking anyone in this draft at 8th overall


As a Raiders fan I'm happy to see Nnamdi go to a good team. He worked hard when he was in Oakland and defined the term shutdown corner. While you can't excuse him for giving up on the Eagles, who honestly didn't. Pretty much every player on that team knew the shitstorm they were in and it showed. It also didn't help that the Eagles threw him into zone coverage when it was known that Nnamdi is a man coverage corner. Come to think of it, the Eagles DC was just horrible when it came to understanding personel. Why would you use a zone scheme when you have DRC and Nnamdi, both good man corners? Makes no sense to me.
Also fuck Matt Flynn it's time for TERRELLE PRYOR
Also fuck Matt Flynn it's time for TERRELLE PRYOR
This a myth.It also didn't help that the Eagles threw him into zone coverage when it was known that Nnamdi is a man coverage corner. Come to think of it, the Eagles DC was just horrible when it came to understanding personel.
According to Pro Football Focus, Nnamdi lined up in press coverage 54.5% of the time, 4th highest in the NFL. He was also a bottom 10 tackler, and QBs had a rating of ~120 when throwing his way. These things are not the Eagles' coaching staff's fault.
The man's lost a step, this much is certain just by watching him play. At age 31, he's almost certainly not going to get it back. The price was so low that it was worth it to take a risk; but he's not going to go back to what he used to be.
TheValkyries
proudly reppin' 2 superbowl wins since DEFLATEGATE
Hahahaha owned.


http://www.nfl.com/news/story/0ap10...-manning-sends-eric-decker-fake-training-bill
Good to see NFL players with a sense of humor and creativity.
Good to see NFL players with a sense of humor and creativity.
this just in: Arizona Cardinals sign long time Steelers backup QB Charlie Batch to a 7 year, $154 million contract (worth approximately $22 million per year). A spokesman for the team said that, since he defeated Flacco at home, he must be better and therefore deserves a bigger contract.


That writer was such a Ravens fan lol
I agreed for the most part, but the part about Julio bugged me. IIRC, Julio only had a slightly better rookie season than Torrey Smith. Matt Ryan's stats were not better all because of Julio, he attempted 100 more passes from 2010 to 2011 and completed around 100 more.
--
Almost draft time! Excited to see how many teams reach for QBs. My current favorite prospects for the Falcons at 30 are
Jamar Taylor CB Boise State
Desmond Trufant CB Washongton
Arthur Brown LB Kansas State
Bjoern Werner DE FSU (apparently he is supposed to drop. Idk)
TheValkyries
proudly reppin' 2 superbowl wins since DEFLATEGATE
Wait, you guys said you read an article. All I read was a full foot and a half of Confirmation Bias.
Even if that article had a point at any time, the writer did an awful job at proving it.
Point 1: Formatting is a huge issue, because you can't properly tell what's going on. A table would have been best, and this format is really distracting. It was clearly just a "here's numbers, I know you won't read them but they prove x" kind of thing.
Here's how it should have looked:
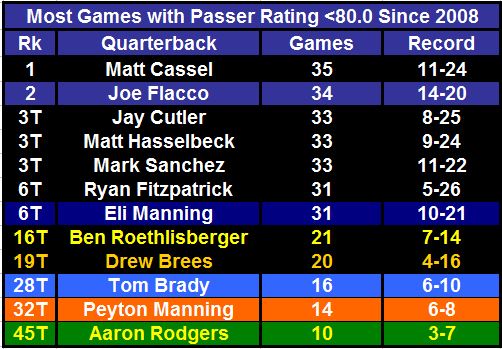
Player: Games with rating +100 / Games with rating 80-100 / 60-80 / under 60 / Games with +80 rating
Brady: 6 / 4 / 4 / 2 / 10
Brees: 5 / 7 / 3 / 1 12
Peyton: 3 / 7 / 5 / 1 10
------------------------------------------------- elite line
Eli: 3 / 6 / 5 / 2 / 9
Roethlisberger: 4 / 6 / 1 / 4 / 10
Flacco: 6 / 3 / 5 / 2 / 9
They're not drastically far apart, but this is a shitty way to compare the players and a shitty formatting for the comparison anyway. If he wanted a real way to measure consistency, a simple average/standard deviation of QB rating (which in itself is a shitty stat) would have sufficed. For example, in this chart it looks like Flacco's stats were better than Peyton's, but if you compare their QB rating statistically:
Peyton (2002): Average QB rating 92.0, std dev of 26.0
Flacco (2012): Average QB rating 87.8, std dev of 30.9
And here's Brady/Brees:
Brady (2005): Average QB rating of 93.0, std dev of 26.1
Brees (2006): Average QB rating of 96.6, std dev of 24.4
So you're saying Flacco is the lowest rated and least consistent of those four quarterbacks!?!? You don't fucking say!
Point 2: Seriously you guys? Seriously?
He posts the stats of the Big 4 - Rodgers + Flacco, then doesn't talk about them. First thing he says is that yardage stats don't matter, then he goes on a completely unrelated tangent about Matt Stafford's inflated yardage and average ypa. He doesn't mention the other stats at all, just declares them "similar." Really?
First, let's look at the ypa for each of the four in their first five years. Taking after this guy, let's play "Find the Flacco!" using letters instead of names:
Player [A]: 7.32 YPA
Player : 7.08 YPA
Player [C]: 7.08 YPA
Player [D]: 7.08 YPA
Freaky. Moving on to TD/Int ratio:
[A]: 1.38 TD/Int
: 1.86 TD/Int
[C]: 1.82 TD/Int
[D]: 1.64 TD/Int
Still not too much of a difference between B/C. Finally, since we all love ratios so much, completion percentage:
[A]: 62.09%
: 61.93%
[C]: 60.55%
[D]: 62.76%
And there we have it. The completion percentages might have spoiled the ending, but C was the correct choice for our hero Joe. I used absolutely no silly persuasive argument to claim Flacco was equal to the rest of these players, I just let the numbers do the talking themselves. Even though he's less accurate than the other three, Flacco was basically on par with them for his first five seasons.
Player A was Peyton Manning, Player B was Tom Brady and the real winner here, and player D was Drew Brees.
Point 3: This argument was even sillier than the last one. Small sample size for the actually good quarterbacks, arbitrary cutoff, proving the opposite of what he was arguing, etc.
Comparisons: It's silly to compare at all with the young QBs in the league, because we have no idea if they'll be able to sustain their success.
The "ceiling QB" section might have been able to show something by comparing their stats, but he just blew it out of the water by comparing wins. Newsflash: Wins are not a quarterback stat.
The "not battle tested" section was fine, except for throwing Matt Ryan in there... but I'm too butthurt to argue against that one.
ITT: Killah makes fun of an article's formatting, can't properly format his own posts
Final verdict: 4/10, for making me salty enough to reply.
shhhh. no tears. only dreams now.Wait, you guys said you read an article. All I read was a full foot and a half of Confirmation Bias.
- Status
- Not open for further replies.